
If you search for the return on investment of AI automation, you will find confident numbers within seconds. Cost reductions of 20 to 30 percent. Error rates down by 70 to 90 percent. Payback in six to eighteen months. Named companies with returns in the thousands of percent.
This article traced eighteen of those figures — every numeric claim in its own earlier draft — back to whoever was said to have produced them. Not one of the eighteen held up.
That is a finding about one badly sourced article, not a law of nature. But the failure modes it exposes are worth recognising before you put any similar figure in a business case. So this article first shows what the tracing found, then sets out what the measured research does show, and finally builds a payback model out of assumptions you can see, argue with, and replace.
Start by distrusting the numbers
The figures that circulate about AI automation have a characteristic shape: a precise percentage, a familiar company name, and a citation that leads to a vendor blog rather than to whoever supposedly measured it. Four examples, each traced to its origin.
A hospital’s administrative savings. A widely repeated claim pairs a major US health system with a 40 percent reduction in administrative time and ten million dollars of annual savings. The health system has published neither figure. The 40 percent traces back to a software agency’s blog, where it appears as a generic industry benchmark with no citation attached, on a page whose only sentence about that hospital concerns its capital investment in AI, not its savings. What the hospital has actually published is narrower and more interesting: substantial time savings on a specific clinical image-segmentation task, and a visit-preparation tool saving physicians somewhere between five and thirty minutes depending on case complexity.
A retailer’s conversion lift. A 20 percent drop in cart abandonment and a 14 percent sales increase are attributed to a named national retailer. Both numbers come from a vendor’s marketing page, where they are explicitly a hypothetical worked example for an unnamed company with ten million dollars of revenue. The retailer never reported them. Its actual publicly reported sales trajectory over the relevant period ran in the opposite direction.
A hardware manufacturer’s ROI. A chart in the earlier version of this very article assigned a large computer manufacturer a first-year ROI of 3,650 percent and a third-year ROI of 11,150 percent. The manufacturer has published a first-year figure, and it is 269 percent — about one thirteenth of the claim. Its longest published horizon is four years, not three, at up to 1,225 percent. Both of the real numbers come from a study the manufacturer commissioned about what its customers might achieve by buying its hardware, which is a different thing again from the company’s own operational return.
A company that does not exist. The same chart carried a fourth bar labelled with a company name that returns nothing in any business registry. The closest real match is a small direct-to-consumer catalogue apparel business with a few dozen employees, no AI programme, and a withdrawn IPO filing. It has never published an ROI figure of any kind, because it has never had one to publish.
That chart, and the cost chart that accompanied it, have been removed. The numbers in them were not sourced from anywhere; the four figures above are what happens when you check.
The general lesson is cheap to state and expensive to ignore. A percentage with a company name attached is worth exactly as much as the link behind it. When the link goes to a consultancy blog, an agency landing page, or a post on a professional network, the number has no provenance at all. In this article’s own earlier draft, every single live citation was one of those three.
What the measured research actually shows
There is real research here. It is less dramatic than the marketing material, and considerably more useful.
The largest rigorous field study of generative AI in a production workflow followed 5,172 customer support agents through a staggered rollout. Productivity, measured as issues resolved per hour, rose by about 15 percent on average. The distribution matters more than the average: less experienced and lower-skilled workers improved both the speed and the quality of their output, while the most experienced and highest-skilled workers saw small gains in speed and small declines in quality.1 If your team is already expert at the task you are automating, that study is the one to read before committing.
On payback, a 2025 survey of 1,854 senior executives found that most respondents reached satisfactory return on a typical AI use case in two to four years — against the seven to twelve months they would expect from technology investments generally. Only 6 percent achieved payback inside a year; even among the most successful projects, only 13 percent did.2 The widely quoted “six to eighteen months” is not a finding from that survey or from any other research this article was able to locate; the pages carrying it were vendor and agency marketing.
On error rates, the established literature on human error in clerical and cognitive work puts base error rates for simple but nontrivial actions — writing, calculating, entering data — in the range of 1 to 5 percent, a result consistent across laboratory experiments and industry data collection. Four industry corpuses totalling around ten thousand code inspections averaged between 1.9 and 3.7 percent.3 Claims that manual processes run at 3 to 8 percent are shifted upward from this. Claims that AI cuts error rates by 70 to 90 percent trace, as far as this article could establish, to no measurement at all — every page carrying that range turned out to be a vendor blog citing another vendor blog.
On what an hour of labour actually costs, the US Bureau of Labor Statistics measures the answer quarterly. For private industry as a whole in March 2026, employers paid $46.60 per hour worked in total compensation, of which $32.60 was wages and salaries — wages were 69.9 percent of employer cost, a multiplier of about 1.43.4
Two cautions on using that number. It is an average across all of private industry, and the same release breaks the ratio out by occupation, industry and establishment size, where it moves in both directions — so look up the row that matches your own staff rather than borrowing the headline. And it counts wages plus benefits only: overhead, equipment, recruiting and management time sit outside it, so a genuinely loaded rate is higher than any figure BLS publishes.
One thing no authoritative source publishes: implementation cost broken down by company size. The largest government instrument on business AI use samples about 1.2 million businesses across six rotating panels of roughly 200,000 each, surveyed every two weeks.5 It measures adoption only — 37 percent among firms with 250 or more employees, under 20 percent among firms with four or fewer — and collects no cost or ROI data at all.6 So when a table tells you what a company with 11 to 50 employees spends, to the nearest hundred dollars, it is not reporting a survey, because no survey of that kind is being run.
Work out your own number instead
Since the benchmarks are unusable, the only defensible number is one you build yourself. Four steps, each of which you can complete with information you already have.
- Measure the baseline you already pay. Time per task, tasks per day, effective hourly cost.
- Price the change. One-time build, integration, and training; then the recurring subscription, maintenance and monitoring that follow you every year afterwards.
- Quantify only what you can remove. The saving is a fraction of a cost you can name, never more than that cost.
- Put it on a timeline. Year one and steady state behave very differently, and the difference is the whole point.
Step one: the baseline you already pay
Start with a time study, not an estimate. Document the time per task, the daily volume, and the resulting monthly hours. Then convert hours to money using a fully loaded rate — the BLS figure above is the floor, not the ceiling, and a genuinely loaded rate adds the overhead that BLS does not count.
Error correction belongs in the baseline too, at a rate you have measured rather than assumed. If you have never measured it, the 1 to 5 percent band from the error literature is a more honest starting point than anything a vendor will give you.
A worked example
What follows is a model, not a case study. Every input is an assumption, stated so you can replace it. No client is described and no measured outcome is reported.
A small e-commerce operation processes 20 orders a day. Each order takes 15 minutes of manual CRM entry, confirmation email, and coordination — five hours a day, or 1,320 hours across a 264-day working year. At an effective rate of $23.40 an hour (a $16.36 base wage at the 1.43 multiplier the BLS measures), that is $30,888 of labour. Add $6,600 of error correction, $2,000 of training and $3,000 of turnover cost, and the manual process costs $42,488 a year.
Automating it is assumed to cost $15,000 to build, $8,000 to integrate and $3,000 to train on — $26,000 upfront — plus $9,500 a year for subscription, maintenance and monitoring.
Now the constraint that the original version of this article violated: a saving can never exceed the cost it removes. Assume automation handles 80 percent of the order flow without human touch. Applied to the labour and error correction in scope, $37,488, that returns $29,990 a year. Training and turnover are deliberately left out — they scale with headcount pressure rather than with task volume, and counting them would be the optimistic choice.
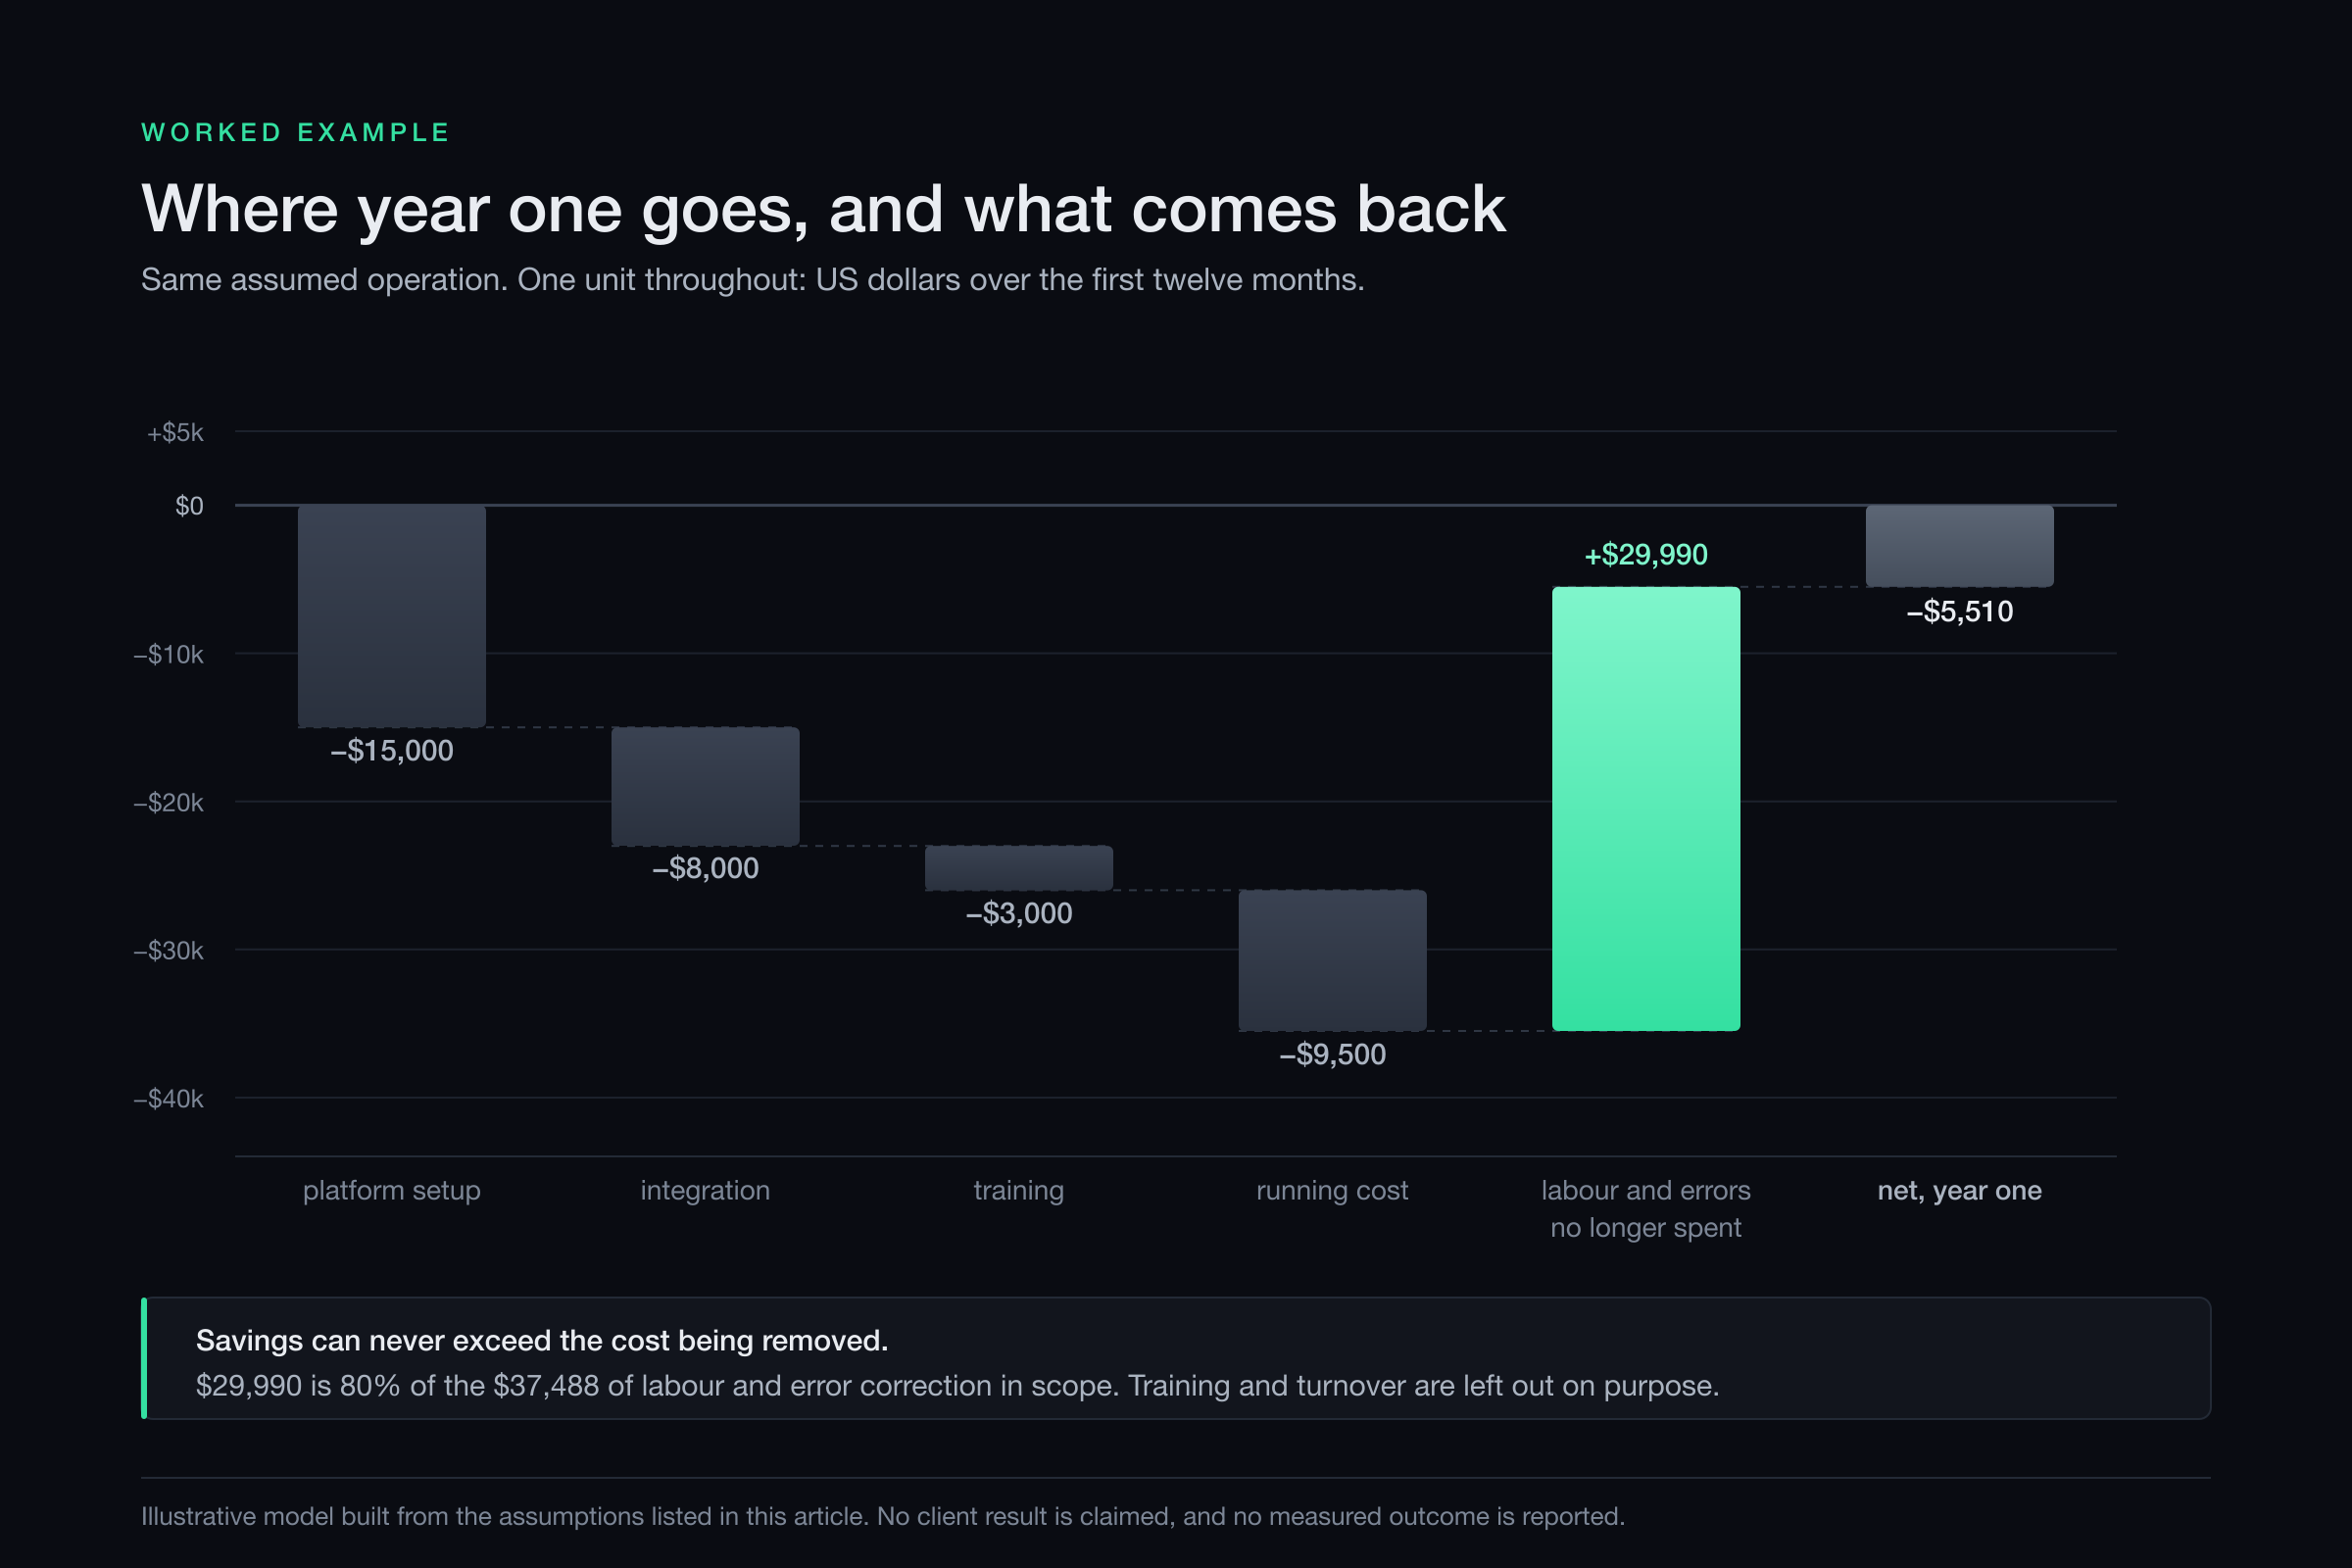
Against $9,500 of annual running cost, the net benefit is $20,490 a year, or $1,707.50 a month. That gives a first year of minus $5,510 — because the $26,000 build lands in it — and a steady-state annual return of 216 percent on the running cost thereafter. Over three years the cumulative position is plus $35,470.
Payback lands during the 16th month. It is worth being exact about this, because rounding the wrong way flatters the investment: at the end of month 15 the cumulative position is still minus $387.50, and it does not turn positive until the end of month 16, at plus $1,320.
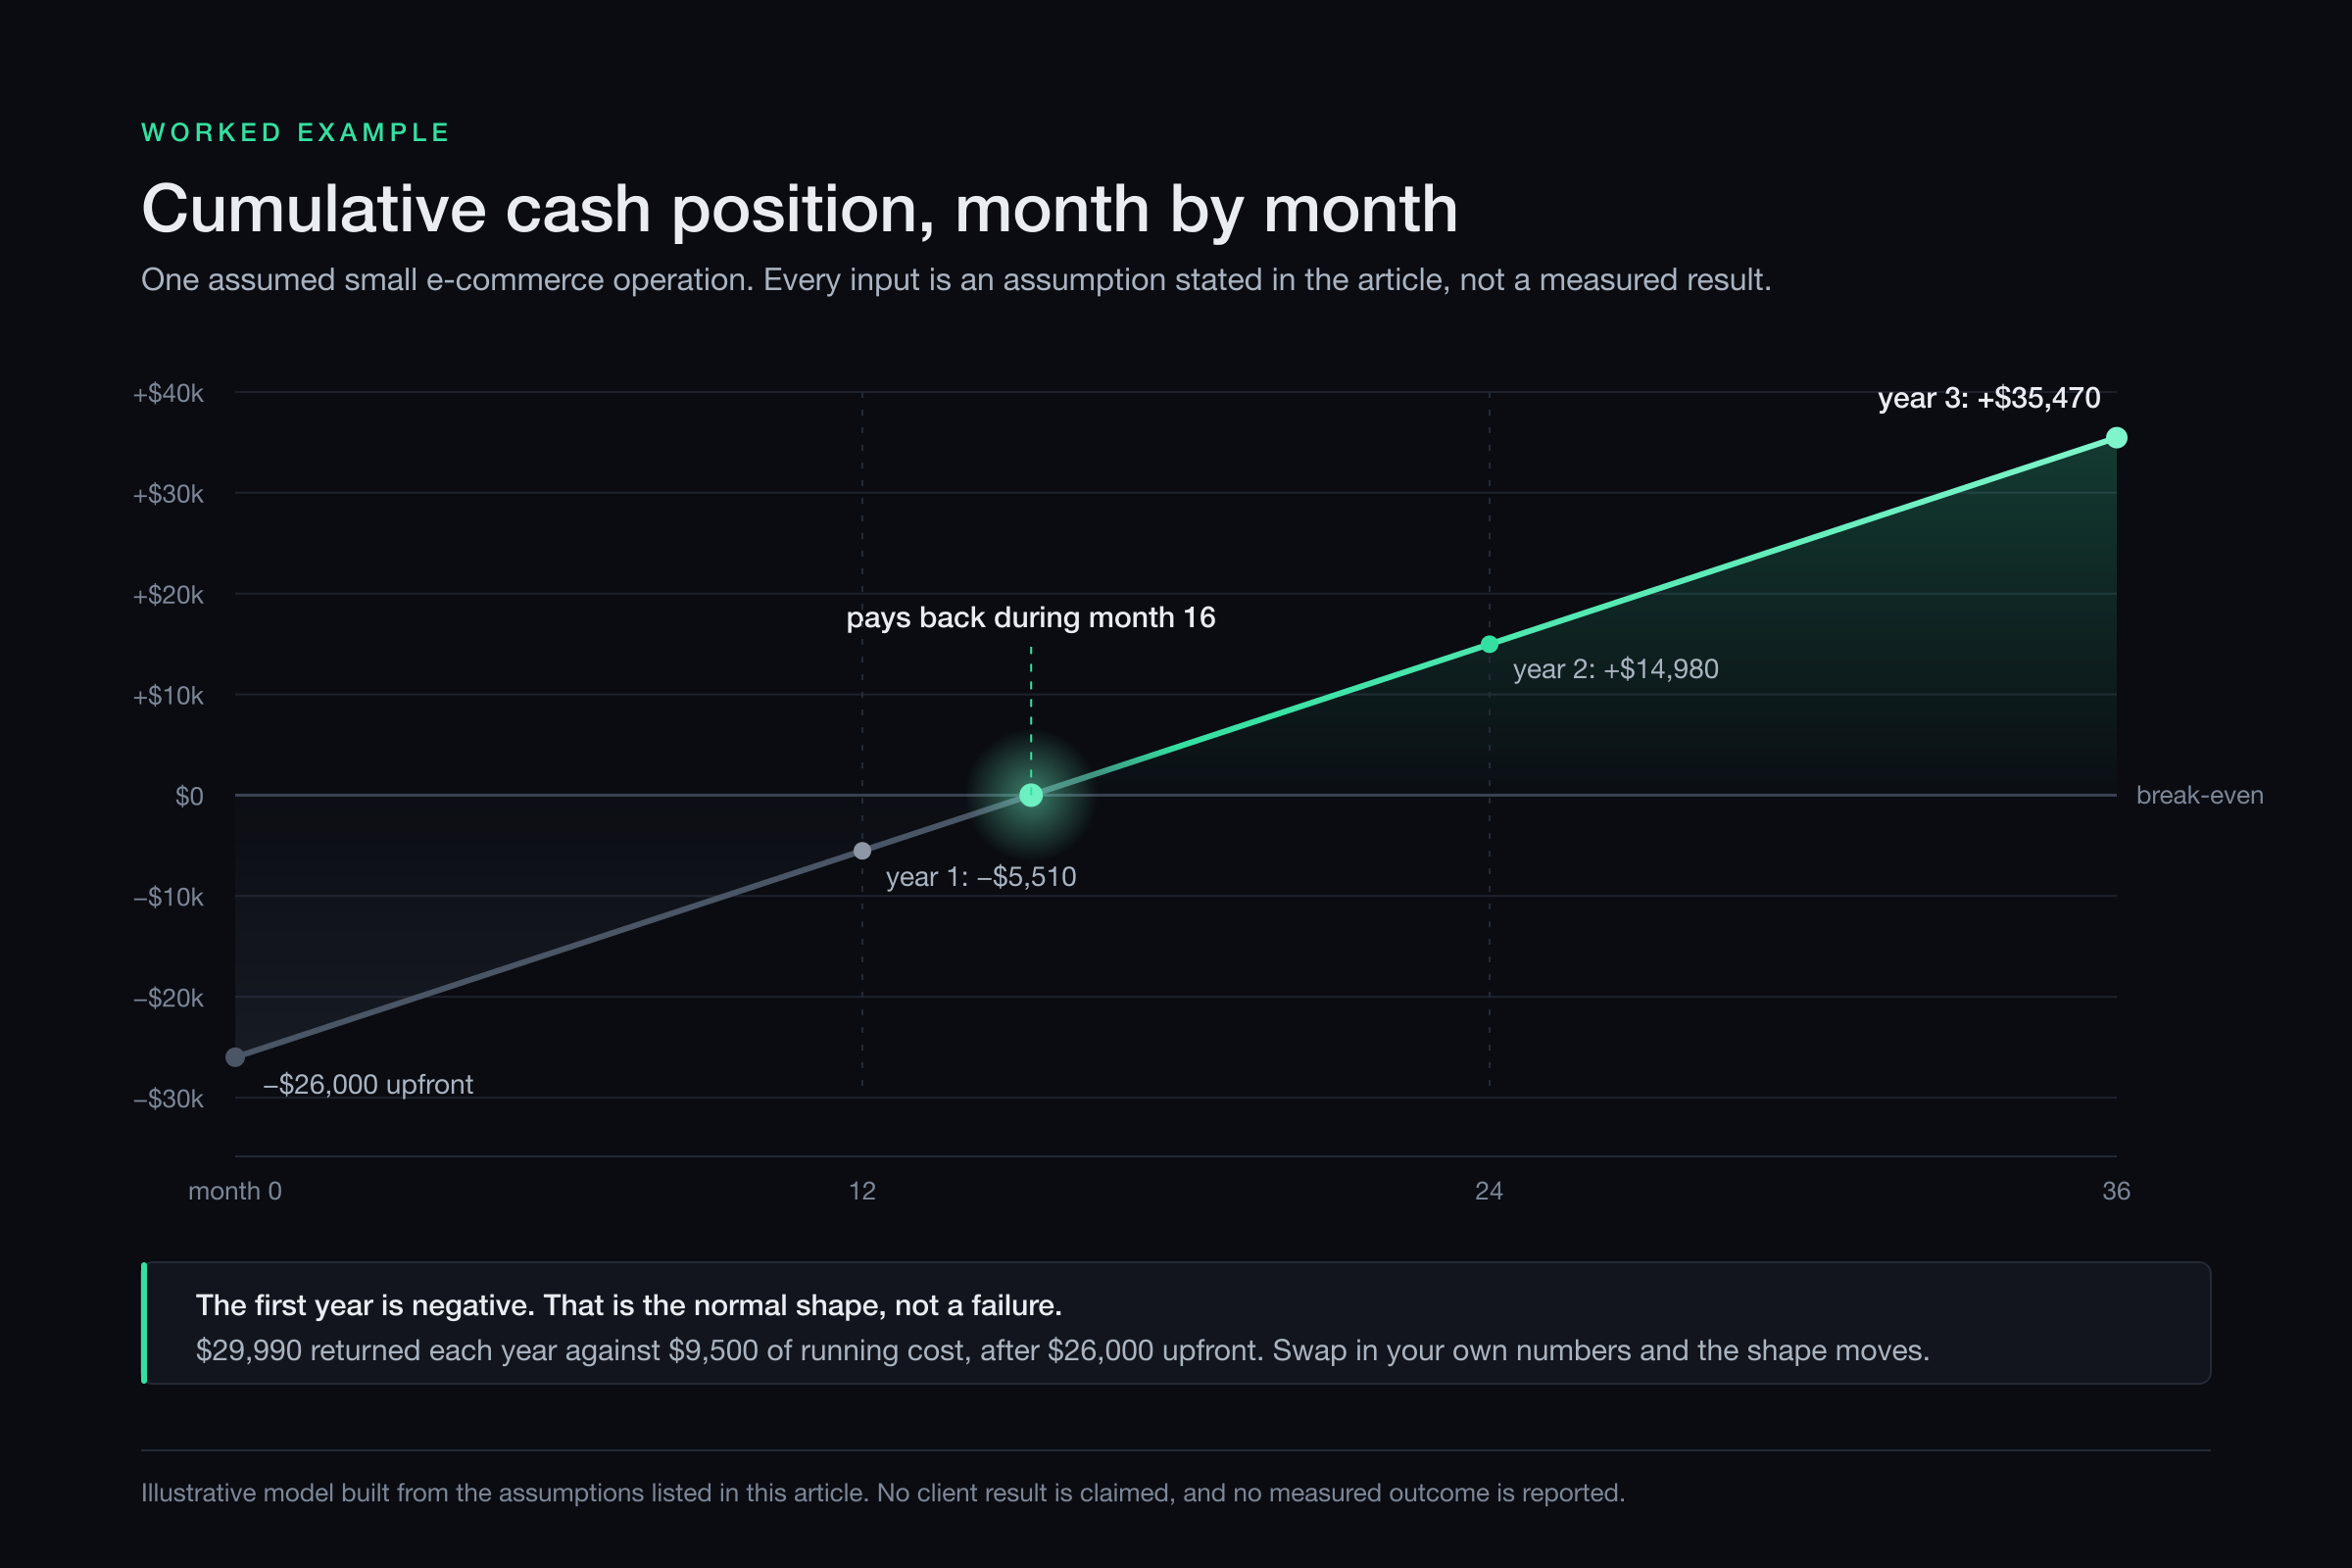
A negative first year is the normal shape of this investment, not a sign of failure. But notice that this model pays back considerably faster than the executive survey found typical — sixteen months against two to four years. That gap is not a validation of the model. It is a warning about it: the survey reports what real organisations experienced across real use cases, while this is an assumed model of the easiest possible case, a narrow, high-volume, rules-driven task with a single load-bearing assumption doing most of the work. If your own model lands far below what practitioners report, the assumption is the thing to interrogate.
What this model deliberately leaves out
It assumes the 80 percent automation rate holds, which is the single most load-bearing and least certain input. It assumes the build lands at $26,000, when scope, data readiness and integration surface routinely move that figure by a factor of several. It assumes nothing breaks, no vendor raises prices, and no one has to be retrained. It counts no revenue, only cost removed. And it says nothing about whether your team is the experienced kind that the support-agent study found gains least.
Change the automation rate from 80 to 60 percent, leaving every other input alone, and the annual return falls to $12,993 and payback slips from the 16th month to the 25th. That sensitivity is the most useful thing in the model: one assumption, moved by a quarter, adds three quarters of a year to the wait.
Costs that move beyond the wage line
Automation touches costs that never appear on a salary line, and they are worth listing even though no honest general percentage exists for any of them.
Recruitment pressure falls when existing staff absorb more volume. Training costs fall where a standardised process replaces individual skill, and rise where staff must now supervise a system instead of operating one. Error correction falls in proportion to the volume genuinely removed from human hands, and no further. Compliance work benefits from consistency, which is a real effect and an unquantified one.
The honest position on all of these is that they are directionally right and specific to your operation. Anyone offering you a percentage for them is guessing.
Getting the implementation right
Begin with process documentation and a baseline measurement, because without a before you cannot compute an after. Pick a pilot with a clear metric and a high, repetitive volume — the same characteristics that make the worked example above the easy case.
Evaluate several providers and read past the demo to the total cost of ownership: hidden fees, integration effort, and what happens in year two. Set your success metrics before you start, rather than reverse-engineering them from whatever the system turns out to do well. Agree a timeline with your supplier and treat change management as part of it rather than as something that happens afterwards.
Above all, project conservatively. The gap between a 60 percent and an 80 percent automation rate is the difference between waiting sixteen months and waiting twenty-five, and the person selling you the system is not the person best placed to tell you which of the two you are buying.
Conclusion
AI automation can be a sound investment for a small or medium business, and the case for it does not need inflating. It needs a task with high volume and low variation, a baseline you have actually measured, an honest estimate of what fraction of that baseline can be removed, and the patience to accept a negative first year.
What it does not need is any of the statistics this article opened by dismantling. The measured evidence is more modest than the marketing — roughly 15 percent productivity gains where they have been carefully studied, payback typically counted in years rather than months, and gains concentrated among less experienced workers. A business case built on those foundations will survive contact with your accountant. One built on a vendor’s blog will not.
Sources. Every third-party figure above was retrieved from the publisher named below. Figures belonging to the worked example are assumptions, disclosed as such in the text, and are not attributed to anyone.
Footnotes
-
Erik Brynjolfsson, Danielle Li and Lindsey Raymond, “Generative AI at Work”, NBER Working Paper 31161; published in the Quarterly Journal of Economics, 2025. https://arxiv.org/abs/2304.11771 ↩
-
Deloitte, “AI ROI: the paradox of rising investment and elusive returns”, 2025 survey of 1,854 senior executives across 14 countries. https://www.deloitte.com/global/en/issues/generative-ai/ai-roi-the-paradox-of-rising-investment-and-elusive-returns.html ↩
-
Raymond R. Panko, “What We Don’t Know About Spreadsheet Errors Today”, Proceedings of the 16th EuSpRIG Conference, 2015. https://arxiv.org/abs/1602.02601 ↩
-
U.S. Bureau of Labor Statistics, “Employer Costs for Employee Compensation — March 2026”. https://www.bls.gov/news.release/ecec.nr0.htm ↩
-
U.S. Census Bureau, Business Trends and Outlook Survey — programme and methodology, including sample design and collection frequency. https://www.census.gov/programs-surveys/btos.html ↩
-
U.S. Census Bureau, Business Trends and Outlook Survey, “Large Firms With at Least 20 Employees Biggest AI Users”, May 2026. https://www.census.gov/library/stories/2026/05/ai-use-businesses.html ↩