
A strategic briefing for Chief Financial Officers
Workflow automation is no longer a speculative technology investment. Done well, it generates measurable cash returns, compresses payback periods, and frees scarce talent for higher-value work. This report equips CFOs with a step-by-step financial framework, current benchmark data, and risk-adjusted evaluation methods to support board-level decisions on automating enterprise processes.
One-sentence takeaway: Well-scoped automation programs typically recover their initial cash outlay within 6-12 months, deliver 200%-plus IRR, and unlock strategic agility that conventional cost-cutting cannot match12.
1. Why ROI Matters to the Finance Office
1.1 Capital discipline under digital pressure
- McKinsey reports 92% of executives are increasing AI budgets, yet 68% still label automation ROI “uncertain”3.
- Rising rates make hurdle-rate compliance tougher; every dollar allocated to bots must out-earn alternative uses.
1.2 Value drivers unique to workflow automation
- Hard savings: labour hours, error rework, paper/storage, early-payment discounts4.
- Revenue lift: faster sales cycles, capacity expansion (up to 30% productivity jump5).
- Risk and compliance: reduction in penalties, audit costs, fraud exposure6.
- Soft gains: talent retention, customer NPS, analytic visibility—often decisive in CFO scoring models.
2. Financial Framework for “True ROI”
2.1 Five-step model
| Step | CFO Action | Typical Data Sources |
|---|---|---|
| 1 | Map the baseline process (cycle time, FTE mix, error rates) | Process mining logs, ERP timestamps |
| 2 | Quantify cost & revenue impacts | Loaded salary rates, SLA penalties, DSO metrics |
| 3 | Calculate total investment | Licences, integration, change-management, cloud OPEX |
| 4 | Model benefits over time | Conservative, realistic, and aggressive scenarios7 |
| 5 | Apply risk-adjusted metrics | Payback period, NPV @ WACC, IRR, sensitivity bands |
2.2 Core equations
Net Benefit (Year n) = Hard Savings + Revenue Uplift – Ongoing Costs ROI = Σ Net Benefits / Total Investment Payback Months = Total Investment / Average Monthly Net Benefit
3. Benchmarks from Recent Case Studies
| Sector & Scope | Hard ROI | Payback | Key Lever | Source |
|---|---|---|---|---|
| ASEAN bank – RPA for core-banking data moves | 1800% | 0.5 mo | 83% cycle-time cut | 8 |
| Global enterprises (average RPA suite) | 250% | 7.5 mo | Labour & error savings | 9 |
| U.S. healthcare system – revenue-cycle suite | 275% | 12 mo | Denial reduction 46% | 10 |
| Mid-size manufacturer – invoice automation | 120% | 18 mo | Early-pay discounts | 11 |
The dispersion highlights the CFO’s task: align automation scope with highest-yield constraints rather than generic “bot counts”.
Real-world payback variability
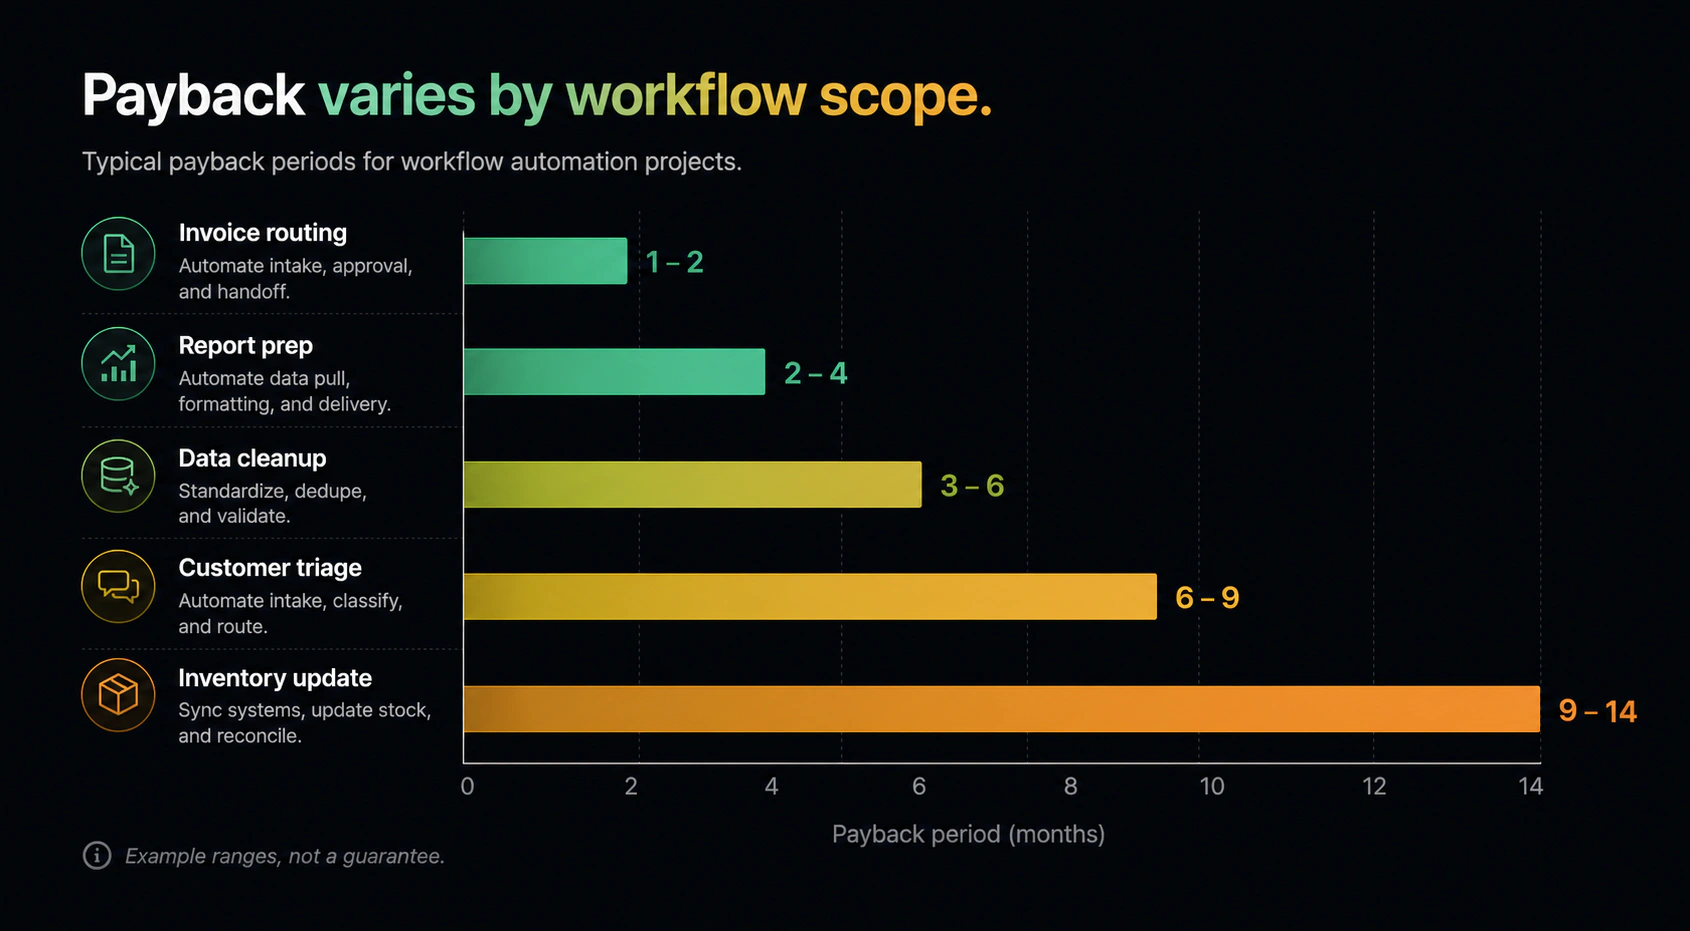
Real-world workflow automation projects show widely varying payback periods, from weeks to over a year.
4. Deep-Dive: SME Financial Model
Many CFOs manage firms of 20-500 employees, where capital is scarce and risk tolerance modest. An illustrative year-1 P&L impact:
| Labour | Errors | Cashflow | Total Benefits | Software | Impl. | Training | Total Costs | |
|---|---|---|---|---|---|---|---|---|
| USD 000 | 120 | 30 | 20 | 170 | 40 | 15 | 5 | 60 |
- ROI = 170/60 = 283%
- Payback = 60 ÷ 14.2 = 4.2 months
Benefit-cost composition
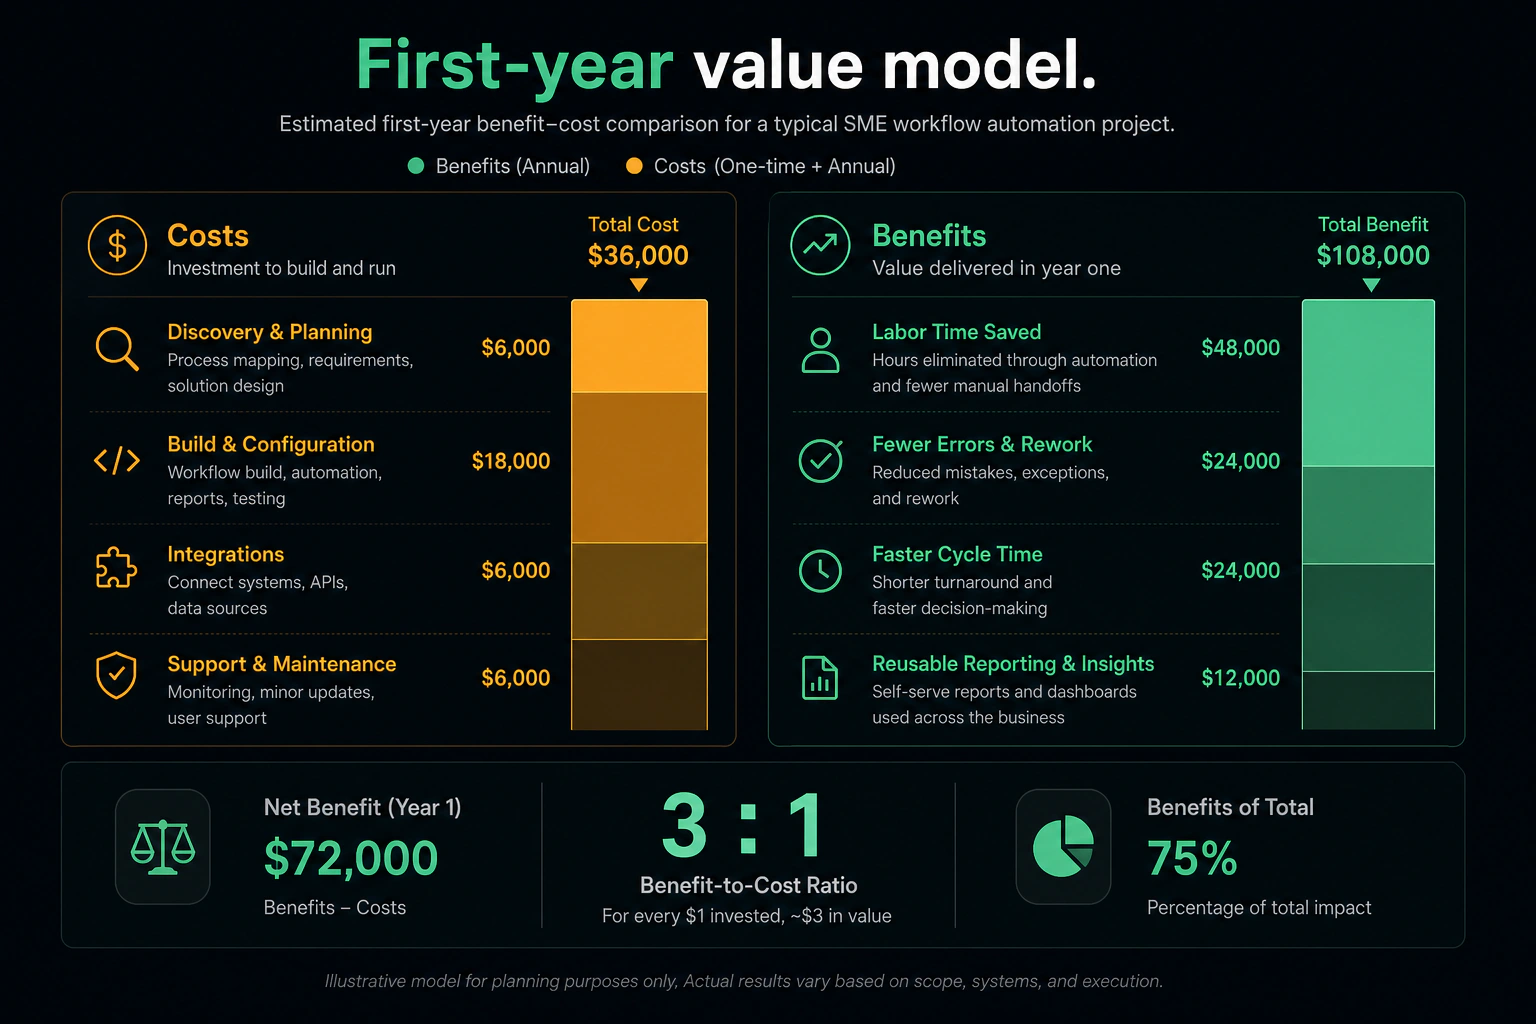
Example SME project: benefits outweigh costs 3:1 in first year.
5. From Pilot to Portfolio: CFO Playbook
5.1 Selecting high-yield candidates
- High volume + rule-based + error-sensitive (AP/AR, order-to-cash).
- Processes throttling revenue (prior-auth in healthcare10).
- Compliance hotspots with audit penalties (KYC, HIPAA, VAT).
5.2 Funding and governance
- Cap-ex vs Op-ex: SaaS licences often qualify as operating expense, easing budget approvals.
- Gate model: require documented FTE redeployment plans and revenue KPIs before scale-up.
- Establish “automation dividend” policy—e.g., 50% of savings recycled into further bots.
5.3 Risk mitigation
| Risk | CFO Control Lever |
|---|---|
| Inflationary software renewals | Locked multi-year price caps |
| Change-fatigue among staff | Incentive sharing & gamified adoption12 |
| Cyber & data breach | SOC 2 Type II vendors, segregation-of-duties |
6. Measuring Intangibles
While cash metrics dominate, deal-approval memos increasingly score qualitative value. Use proxy metrics:
- Employee net-promoter score rise ≥ 5 points as proxy for turnover savings13.
- Customer query first-response time cut to < 5 min maps to upsell probability uplift.
- Audit cycle shortened by x weeks; convert to avoided consulting fees.
7. Strategic Outlook
- Generative AI + workflows: foundation models embedded in orchestration engines slash set-up costs by 30-40% and lift bot accuracy to > 90%14.
- Composable platforms: low-code stacks allow finance teams to self-serve automations under IT governance, reducing change-order spend.
- Sustainability accounting: automated data capture for Scope 3 emissions reporting will become a board mandate—early movers secure credibility premiums.
Conclusion
For finance leaders, “true ROI” means cash-verified gains plus option value for agility and compliance. Applying rigorous financial gates, leveraging current market benchmarks, and capturing soft benefits in monetary proxies empowers CFOs to champion automation confidently—and to turn digital rhetoric into shareholder value.
Footnotes
-
https://gravityflow.io/articles/measure-workflow-automations-roi/ ↩
-
https://www.nextprocess.com/bpo-solutions/the-roi-of-automating-financial-workflows-what-cfos-should-expect/ ↩
-
https://develop-llc.com/insights/hidden-roi-of-automation-for-manufacturers/ ↩
-
https://www.auxiliobits.com/the-cfos-guide-to-automation-investment-and-payback-periods/ ↩
-
https://www.exelatech.com/blog/roi-robotic-process-automation-comprehensive-analysis ↩
-
https://www.sec.gov/Archives/edgar/data/1990354/000110465924054188/tm2333808-3_s1a.htm ↩ ↩2
-
https://www.eraneos.com/ch/wp-content/uploads/sites/3/2025/04/Eraneos_ROI-RPA_Whitepaper_EN.pdf ↩
-
https://camunda.com/blog/2024/06/the-roi-of-automation-understanding-the-impact-on-your-business/ ↩